What is Share of Voice and How Do You Measure It?

September 19, 2025

Share of voice (SOV) is the percentage of industry conversations that mention your brand vs your competitors.
Think of it this way: say there are 100 total mentions of businesses in your industry this month, and 15 of those mentions factor in your company, your share of voice is 15%. If your marketing budget is disappearing into a black hole and you’re spending thousands without the results to show for it, you’re not seeing results because that capital is flowing to your competitors.
The issue: one player’s investing in marketing without measuring impact, while the other engages audiences that actually convert.
By the end of this article, you’ll walk away with a comprehensive grasp on share of voice, how to apply it to your business, and which specific actions to take based on your results.
Why is Share of Voice Important?
For top sales and marketing teams, share of voice isn’t just a vanity metric — it’s competitive intelligence that directly impacts your lead generation, brand positioning, and marketing ROI. When understood, it allows you to take action on how much of your industry’s chatter belongs to you.
Flag Competitive Threats Early On
If a rival gains a sudden spike in SOV, it may signal aggressive promo pushes or product launches. Catching this early allows your business to pivot messaging or launch counter-campaigns that frontrun competitors eating into your pipeline.
Guides Budget Allocation
With social media and paid ads marketing taking the front seat in user acquisition for most markets, channel-level SOV (e.g., TikTok vs Google Ads) shows where voice gaps may be the widest. Understanding where your top traffic comes from can help you redirect ad dollars to the most under-represented, high-intent channels for increased win efficiency.
Measures Brand Momentum Beyond Clicks
SOV captures organic buzz – earned media, social shares, and podcast mentions that may not be accounted for in raw traffic numbers. Tracking intangible brand equity drives long-term loyalty and high lifetime value from your customers (LTV).
Sets Realistic Growth Targets
Understanding your category’s total conversation share shapes lead and sales goals within your market reality. By backing data to targets as opposed to blind projections will massively reflect in your company’s revenue.
Metrics Used to Measure Share of Voice
How you interpret SOV will hinge on a set batch of data that may be more or less relevant depending on the industry you operate in. It’s a composite picture that shows where and how loudly your brand is being heard when placed next to your competition. To illustrate that picture, you’ll need to look at a distinct set of complementary data points.
Advertising
In SOV, this reflects your brand’s presence in paid advertising compared to competitors across all channels. And by examining ads, you can see not only where your message is most visible, but also identify gaps where additional budget or creative pivot may be required.
These may encompass: display, video, radio, TV, social media, and out-of-home advertising. Track your ad spend and frequency relative to competitors to understand your market position.
Media Coverage
How publishers mention your brand compared to competitors will reflect itself in your media coverage stats. Monitoring this metric reveals whether thought leadership initiatives and PR outreach are gaining traction from the sources your audience trusts.
Media may be especially valuable for B2B companies trying to establish a leading voice and credibility, with lots of value found in backlinks, citations, and mentions traced back to you. When done correctly, you can position your firm as an authority among industry conversations.
Social Media
In SOV, Social media share of voice accounts for brand mentions, hashtags, and user engagement across platforms. Consistent tracking reflects which companies are pulling the most conversation and sentiment among target audiences.
Local or regional businesses benefit from monitoring neighborhood-level conversations, allowing for more community-driven feedback on products, services, or events. This can translate into more relevant and actionable data by leveraging real-time sentiment.
SEO
Organic search SOV shows you how often your website appears to customers compared to competitors for relevant keywords. Higher visibility here translates to increased opportunities for prospective customers to discover your brand without clicking an ad, reducing potential overall spend.
Search Engine Optimization (SEO) measures your visibility on search listings. It can be tracked through a number of resources like Google Search Console, SEMrush, or Ahrefs. Regular audits can spotlight ranking declines, new keyword opportunities, and topics where competitor content is outperforming yours.
Pay-Per-Click (PPC)
PPC measures your brand’s exposure in paid search results relative to other advertisers. Google Ads labels this metric “impression share,” showing the percentage of eligible auctions in which your ads appeared.
Low impression share may signal budget constraints and low bids, while higher ones may reflect increased keyword coverage or customer understanding. This directly impacts your ability to capture high-intent searchers.
Brand Mentions
Share of voice under this metric will show you the percentage of brand-relevant keywords your company ranks for in comparison to competitors across all relevant channels, such as organic search, review sites, forums, and social media.
Tracking brand mentions highlights which organization dominates essential terms in your sector, indicating overall authority. Continuous monitoring also surfaces emerging topics or phrases you can incorporate into content, product messaging, or campaigns to maintain leadership.
Impressions
When benchmarked against competitors, impression share offers the broadest snapshot of digital reach and audience exposure. Your total digital visibility will aggregate the number of times any asset bearing your brand appears across channels, including social, search, display, and video.
Rising impression counts relative to competition can suggest growing awareness, while declines may flag reduced share of attention. Combine impression data with engagement and conversion metrics to ensure that visibility is rendering tangible results. Tools like Google Search Console help you get a clearer understanding of this metric.
How do I measure share of voice?
To turn SOV from a concept to a usable KPI, follow a structured workflow. Outlining a clear and repeatable process is imperative to seeing the long-term growth results of implementing the data this gives you. Start by outlining a clear and repeatable process—it’s important to understand who you compare yourself to, what metrics stand out, and how you’re going to gather that information – then the math comes in. Here’s a pathway to get there:
Step 1: Define Your Competitive Set
Build a concise list of three to five direct competitors—particularly those that vie for the same set of customers and operate in the same geography, price tier, or niche. A narrow focus keeps tracking realistic and prevents you from diluting your insights with irrelevant data.
- Search like a buyer: Type in your top product/service keywords, then jot down the brands that appear twice—once in ads, once in organic results.
- Validate with customers: You may want to introduce post-checkout customer surveys that aim to better understand your customers. “Thank you for _____. We appreciate _____. Quick question that helps us make ____ better for you: Which other companies did you compare us with?”
- Weed out for relevance: Filter the businesses that serve the same geography, target market, and price band as you.
Step 2: Choose Your Measurement Period
Understand and set an appropriate review cycle time in order to tie those dates to an existing ritual (e.g., first Tuesday sales meeting). By doing so, you’ll stay in the loop on industry movements, ensuring you never miss a period.
Weekly: Review share-of-voice data once a week if you release new offers or work in a news-heavy niche where shifts occur every 1-2 weeks. Block out times during a sales huddle to flag any dips or spikes, and act on them before they impact revenue.
Monthly: When your sales cycle spans 30–90 days and industry news moves at a steadier pace, a month-end audit provides enough signal without daily noise. Add the report to your regular month-close marketing recap so trend lines are clear. By balancing signal and effort; trends can stand out more without micromanagement.
Quarterly: If major campaigns, product updates, and budget decisions follow quarterly rhythms, gather share-of-voice metrics once every few months. Align the pull with your QBR or strategic planning session to filter out random blips and focus on meaningful market shifts. This timeline can help separate you from “false alarms” on tiny datasets.
Step 3: Gather the Data
Now that you know who to track and how often, you’ll need to collect actionable numbers that can be used to come to conclusions within your datasets. By automating inputs wherever feasible, you’ll cut down time on analyzation and get right to comprehending where you sit.
- Create a simple capture sheet (Google Sheets or Excel works fine) with columns denoting Date, Channel, Your Mentions, Competitor Mentions, and Total Mentions.
- Automate free alerts first
-
- Google Alerts: Set for the 3—5 brands filtered in step 1.
- Search Console: Export Impressions for your top 50 keywords.
- Native social dashboards: Download monthly CSVs.
- Layer on paid monitoring
-
- Below $100/mo: Mention, Brand24, Agorapulse — good for one-click exports.
- $100 — $500/mo: Hootsuite Insights, Buffer Analyze — creates a better context for sentiment and historical depth.
- Enterprise: Sprout Social, Brandwatch, Talkwalker — API feeds and cross-channel duplication.
- Paste or import each data dump into your sheet; tag by channel so formulas roll up automatically.
Step 4: Apply the math
After acquiring statistics, the next move is to convert them into percentages that’ll demonstrate your brand’s presence in the market. You’ll then be able to leverage this data into actionable insights that can steer you in the right direction.
Formula
First, we’ll go through a basic overview of calculating share of voice – this will be most important to understanding how we arrive at these numbers.
- Share of Voice = (Your Brand Mentions ÷ Total Industry Mentions) × 100
- For search, it’s: (Your Impressions ÷ Total Available Impressions) × 100
How to use formulas in spreadsheets
You won’t be doing these calculations by hand. With the number of metrics you’ll have to go through, it’s most efficient to create a spreadsheet that lays out the numbers for you. By implementing this practice, your company will be able to look back on the historical context of how you’re actions on these metrics have affected you, and how you can gradually become more accurate.
In a Google or Excel sheet, add these calculated columns with the “=IF” function :
- Your SOV → = columns C2 (Your mentions)/G2 (Total mentions)
- Full Version: =IF($G2=” ”,” ”,(C2/$G2) * 100
- For the sum of total mention =SUM (add applicable rows)
- Full Version: =IF($G2=” ”,” ”,(C2/$G2) * 100
- Competitor SOV → = D2/G2, (E2/G2; F2,G2; etc. to see all competitors side by side)
- Refer to the full version above and repeat
Use conditional formatting to flag:
- Green when your SOV ↑ 10%+ vs. last period
- Red when it ↓ 10% vs. last period
Turn Data Into Action
Once you receive your data, you’ll need to understand what it means, and what to do. Raw percentages don’t drive business results—actions do. So why not turn those numbers into growth?
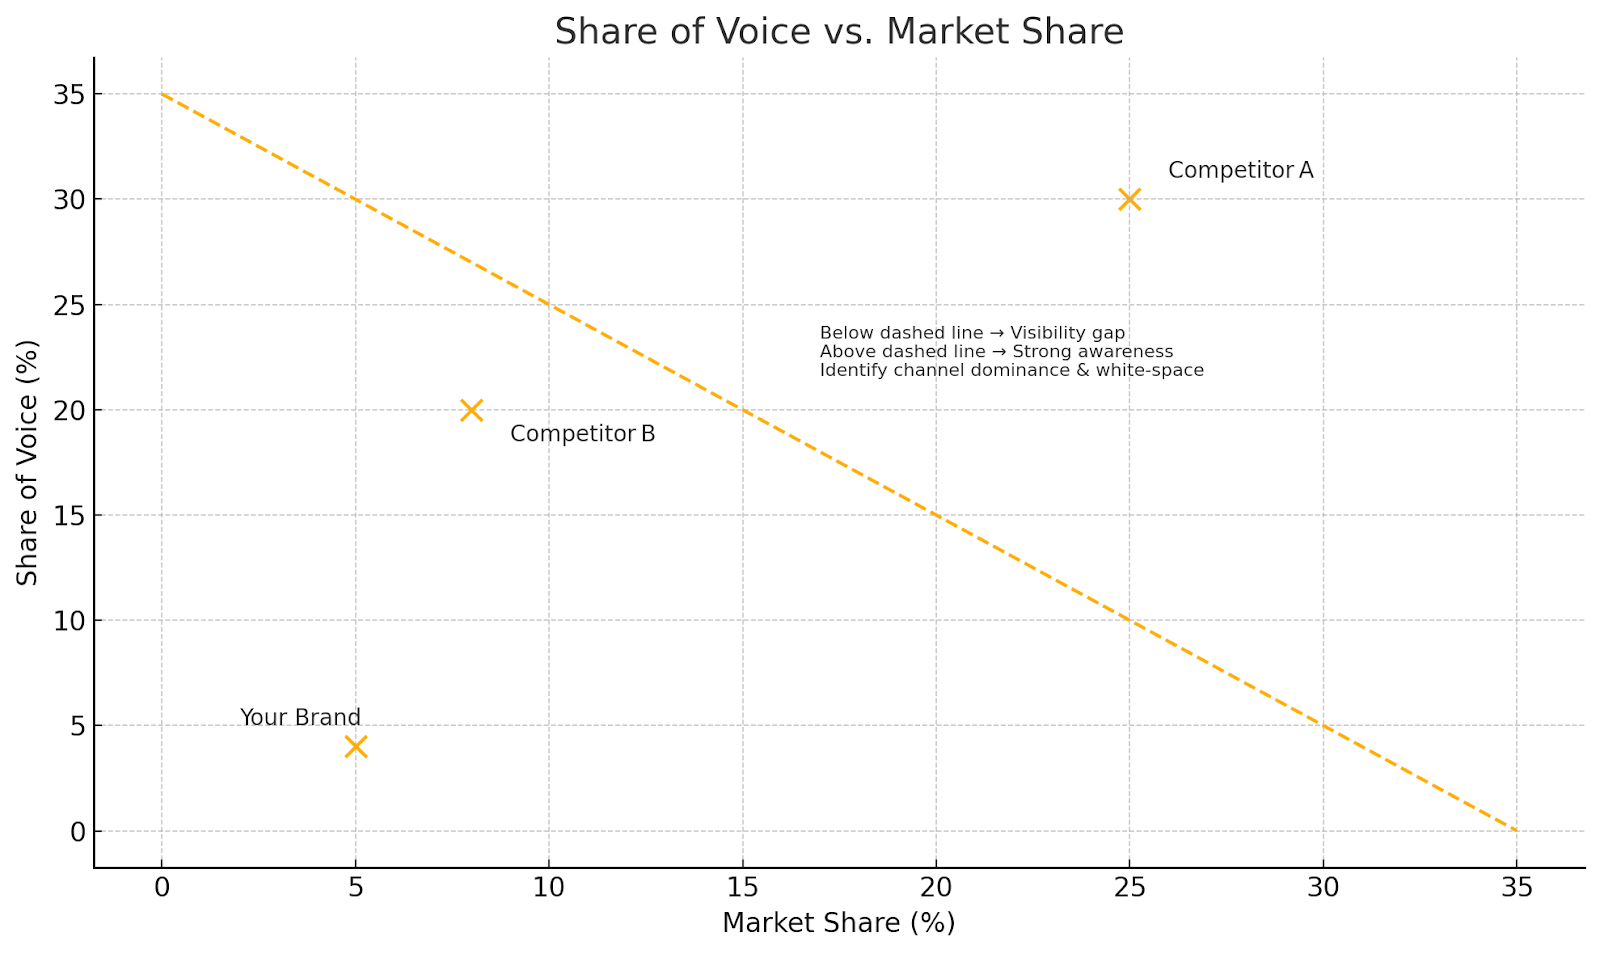
- If your share of voice is lower than your market share: You’re underperforming in brand visibility. Increase content creation, engage more actively on social media, or consider PR outreach.
- If your share of voice exceeds your market share: You have strong brand awareness but weak conversion. Focus on optimizing your sales process rather than increasing visibility.
- If competitors dominate specific channels: Analyze what content or strategies they’re using. You can often find gaps in topics they’re not covering where you can establish authority.
Here’s a model that can help you understand what direction to move in next:
Common Mistakes to Avoid
Getting the data may be the simple part, but acting on it within the context can get complicated. Nuance will be an important part of making the right moves—here are errors to look out for.
Don’t chase vanity metrics
A 50% share of voice means nothing if those mentions don’t connect to your target audience. Quality and relevance matter more than quantity.
Before celebrating or panicking over your share of voice percentage, ask yourself:
- Are these mentions reaching people who could become customers?
- Do the conversations align with our brand positioning and price point?
- Are mentions happening in channels where our ideal clients spend time?
Ex. A local Tex-Mex restaurant might have a low share of voice on Instagram compared to chain competitors, but if they dominate mentions in neighborhood Facebook groups and local foodie blogs, that targeted visibility often drives more revenue than broader, less relevant exposure.
Avoid the comparison trap
If a competitor has been in business for 20 years and you launched last year, their higher share of voice reflects longevity — not necessarily better marketing. Your growth trajectory will mean exponentially more than the absolute numbers.
The most successful small businesses use these metrics as a compass, not a scorecard. It shows you which direction you’re heading and whether your marketing efforts are gaining traction — which matters far more than where you rank today compared to businesses with completely different timelines and advantages.
Ignoring Sentiment Your Numbers
It’s easy for a swelling SOV to hide behind the fact that conversation is negative. Treating every mention as a win can be a dangerous pathway into amplifying problems versus minimizing them with PR efforts. This can easily hinder your lever for growth. Be sure to include Google Alerts to filter for key words indicating negative sentiment.
So dig deeper:
- Is the tone positive, neutral, or negative?
- Are complaints clustering around product quality, pricing, service speed etc. ?
- Does sentiment differ by channel? And if so, how? What’s the source of this?
Ex. A Saas startup sees brand mentions jump 40% after a feature launch, only to find out through tagging that 65% of tweets mention bugs and outages. Had they celebrated the share of voice spike without reading the room, they could’ve double down on promotion instead of quickly approaching a problem.
Take a look at our news on Marketing & Sales